Explore run details#
When you click on a run, the Run details view opens.
Here, you can:
- See all the metadata logged for the run.
- Modify or trash the run.
- Create and manage dashboards for your project.
Getting more space#
Tip
To enlarge the metadata area, you can:
- Minimize the left sidebar with the button.
- Collapse the toolbar with the icon.
- Adjust the number of table columns shown by unpinning them or dragging to minimize the table area.
- Enter distraction-free mode with the button, to temporarily maximize the metadata area.
Run information view#
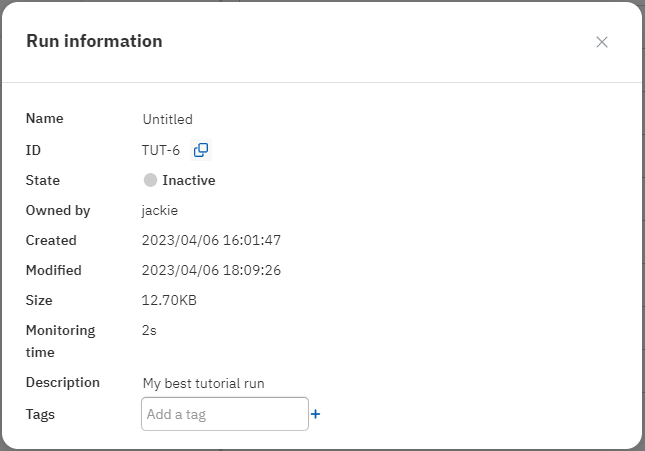
The Run information view shows basic metadata about the run itself: time data, size, owner, and descriptive information.
Here you can also:
- Copy the Neptune ID to your clipboard.
- Edit the name and description.
- Manage tags.
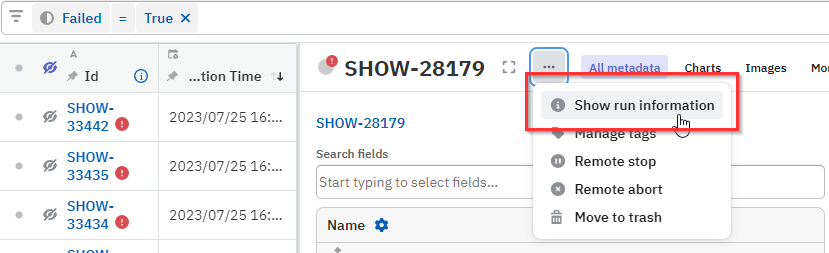
To access the view, click the menu next to the run title () and select Show run information.
Dashboards#
You can switch between dashboards to see the run metadata displayed in different ways.
Related
All metadata#
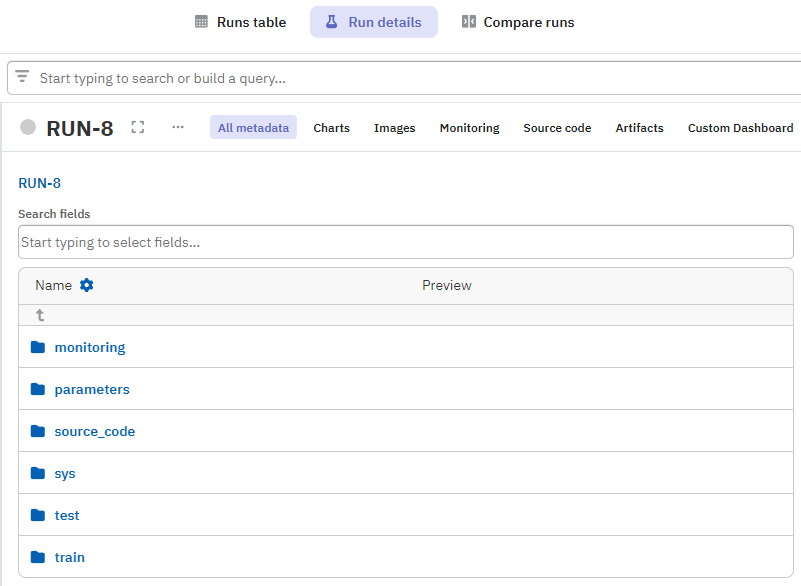
The metadata is presented in a folder-like structure, with all namespaces and fields exactly as they were logged.
You can also see the three automatically generated namespaces:
| Namespace | Description |
|---|---|
monitoring |
|
source_code |
|
sys |
The system namespace, which contains basic metadata about the run (see Run information view above) |
Charts#
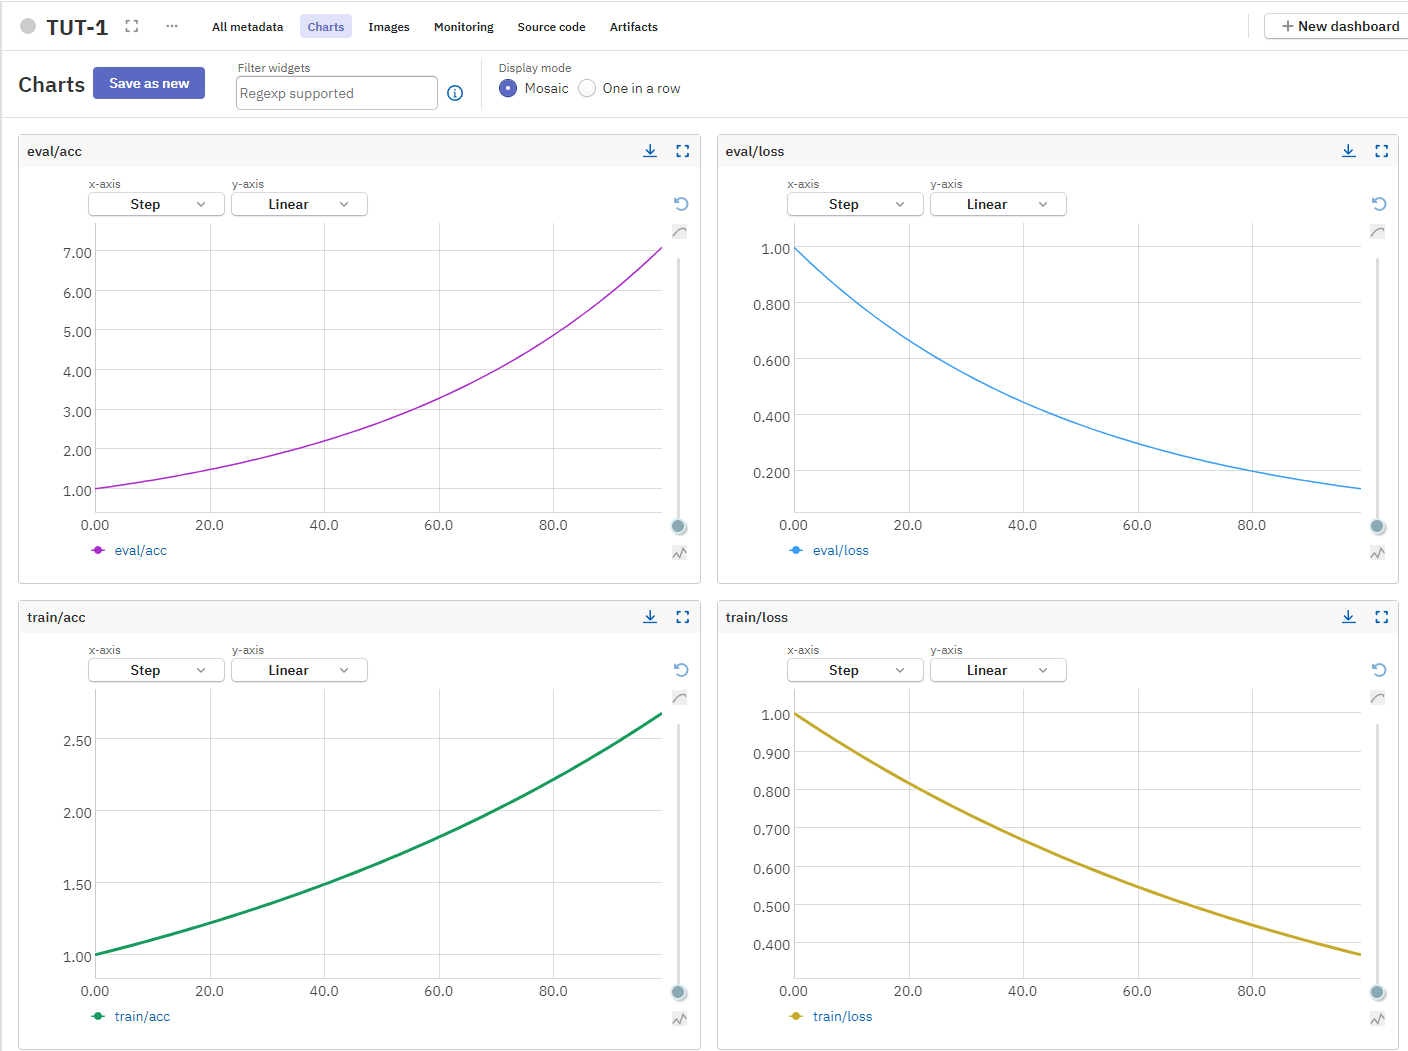
This section visualizes all series of numerical values – like metrics and losses during training – as graphs.
You can filter the charts by typing a string into the Filter widgets input box.
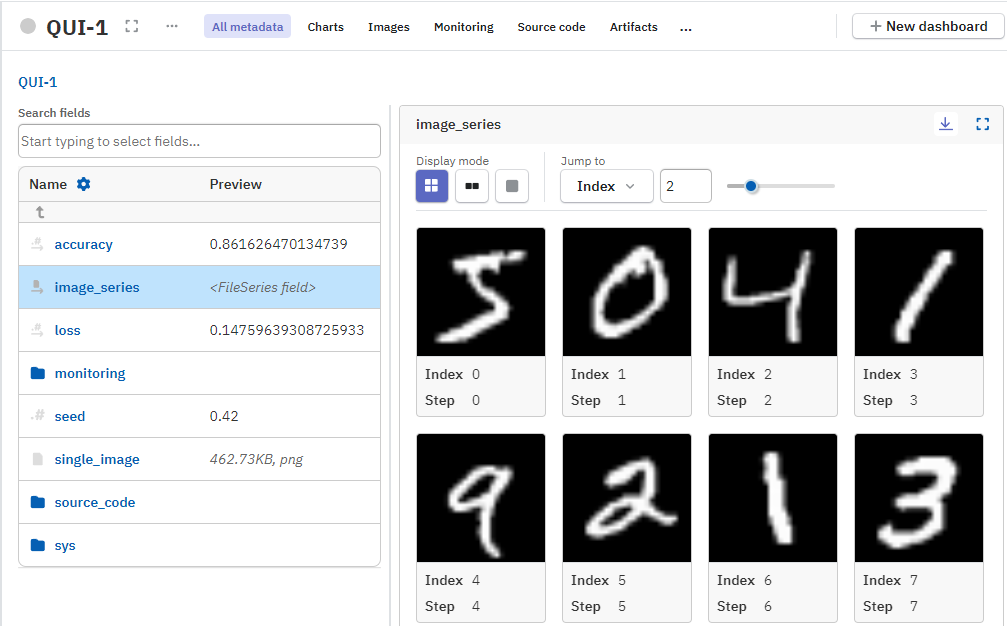
Images#
If image files or figure objects were logged for the run, they appear in this section.
You can download the images from here, or inspect the evolution of an image series in the gallery view.
Related
Monitoring#
This section visualizes system metrics and hardware consumption logged during your run.
Related
Source code#
This section displays source code information, including:
- Code snapshot: The filename and code of the script that was executed.
- Git: Git information, if you have Git initialized in your project directory.
- Notebook snapshot: Jupyter Notebook checkpoints, if you have the neptune–notebooks extension set up.
Artifacts#
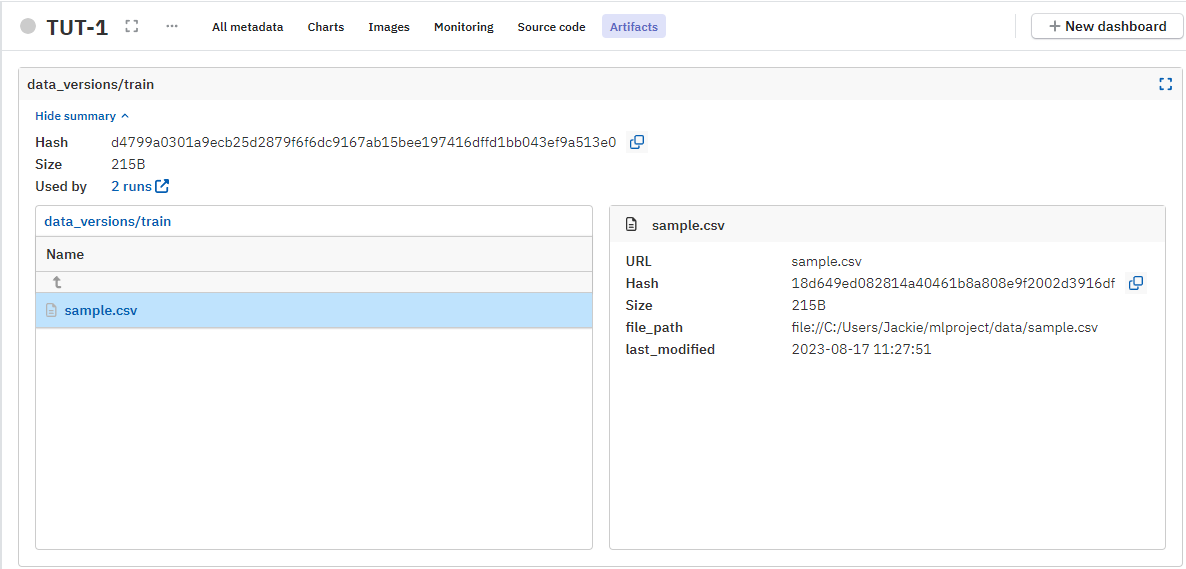
This section displays any files that have been logged as artifacts, with the track_files() method.
Click on the files to view the artifact metadata, such as hash, size, and path.
Related